What is Technical Analysis :- Any business needs certain tools and techniques to start with.
Much like you approach an engineer when you’re planning to build a house,
you need to approach a reliable expert when it comes to trading,
Technical analysis is the framework in traders study price movement.
The theory is that a person can look at historical price movements and determine the current trading conditions and potential price movement.
The main evidence for using technical analysis is that, theoretically, all current market information is reflected in price.
If price reflects all the information that is out there, then price action really to trade.
have you ever heard the old adage, “History tends to repeat itself“?
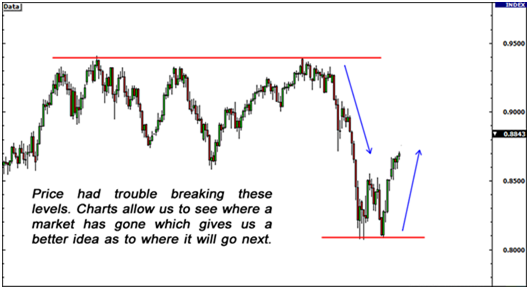
Well, that’s basically what technical analysis is all about! If a price level held as a key support or resistance in the past,
traders will keep an eye out for it and base their trades around that historical price level.
Technical analysts look for similar patterns that have formed in the past,
and will form trade ideas believing that price will act the same way that it did before.
when someone says technical analysis, the first thing that comes to mind is a chart.
Technical analysts use charts because they are the easiest way to visualize historical data!
You can look at past data to help you spot trends and patterns which could help you find some great trading opportunities.
What’s more is that with all the traders who rely on technical analysis out there, these price patterns and indicator signals tend to become self-fulfilling.
As more and more TRADE traders look for certain price levels and chart patterns, the more likely that these patterns will manifest themselves in the markets.
You should know though that technical analysis is personal Perspective
Rahul and amit are looking at the exact same chart setup doesn’t mean that they same idea of where price may be headed.
Technical analysis is metho for forecasting the direction of prices through the study of past market data, primarily price and volume.
Technical analysis active management, stands in modern portfolio theory.
Market prices are essentially unpredictable in Fundamental analysts examine earnings, dividends, , new products, research and more.
But in technical analysts seek to identify price patterns and market trends in financial markets.
A principle of technical analysis is that a market's price reflects all relevant information,
so their analysis looks at the history of a security's trading pattern rather than external drivers such as economic,
fundamental and news events.
Prices move in Market trend
Technical analysts believe that prices trend directionally, i.e., up, down, or sideways (flat) or some combination.
Types of charts
Line chart:- Connects the closing price values with line segments.
Open-high-low-close chart:– OHLC charts, also known as bar charts, plot the span between the high
and low prices of a trading period as a vertical line segment at the trading time, and the open and
close prices with horizontal tick marks on the range line, usually a tick to the left for the open
price and a tick to the right for the closing price.