Trading with Pivot Points :- Professional traders use pivot points to identify potential support and resistance levels. Simply putting , a pivot point and its support/resistance levels are areas at which the direction of price movement can possibly change,
why pivot points are so enticing?
With pivot points, traders typically use the same method for calculating them.
Many traders keep an eye on these levels and you should too.
pivot points are especially useful to short-term traders who are looking to take advantage of small price movements. Just like normal support and resistance levels, traders can choose to trade the bounce or the break of these levels.
Range-bound traders use pivot points to identify reversal points. They see pivot points as areas where they can place their buy or sell orders.
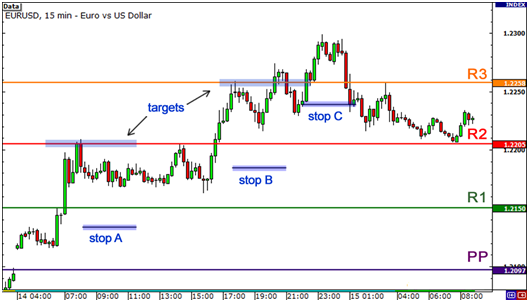
Breakout traders use pivot points to recognize key levels that need to be broken for a move to be classified as a real deal breakout.l
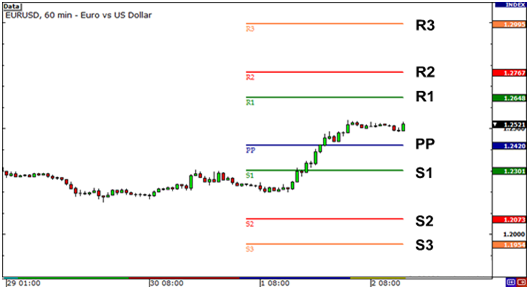
Here is an example of pivot points plotted on a 1-hour abc stock chart