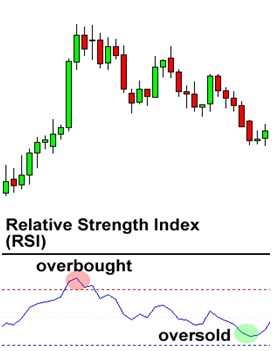
RSI, is similar to the stochastic in that it identifies overbought and oversold conditions in the market.
It is also scaled from 0 to 100. Typically, readings below 30 indicate oversold, while readings over 70 indicate overbought.
How to Trade Using RSI
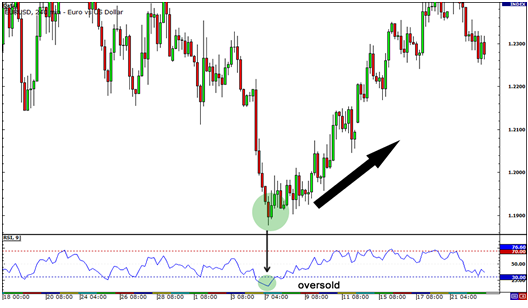
RSI can be used just like the stochastic. We can use it to pick potential tops and bottoms depending on whether the market is overbought or oversold.
Below is a 4-hour chart of EUR/USD.
EUR/USD had been dropping the week, falling about 400 PROFITs over the course of two weeks.
On June 7, it was already trading below the 1.2000 handle. However, RSI dropped below 30, signalling that there might be no more sellers left in the
market and that the move could be over. Price then reversed and headed back up over the next couple of weeks.
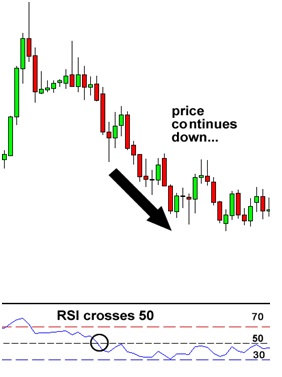
Determining the Trend using RSI
RSI is a very popular tool because it can also be used to confirm trend formations. If you think a trend is forming, take a quick look at the RSI
and look at whether it is above or below 50.
If you are looking at a possible uptrend, then make sure the RSI is above 50.
If you are looking at a possible downtrend, then make sure the RSI is below 50.
In the beginning of the chart above, we can see that a possible downtrend was forming. To avoid fake outs, we can wait for RSI to cross below 50 to confirm our trend. Sure enough, as RSI passes below 50, it is a good confirmation that a downtrend has actually formed.