Up until now, we’ve looked at indicators that mainly focus on catching the beginning of new trends. it is equally important to be able to identify where a trend ends. After all, what good is a well-timed entry without a well-timed exit?
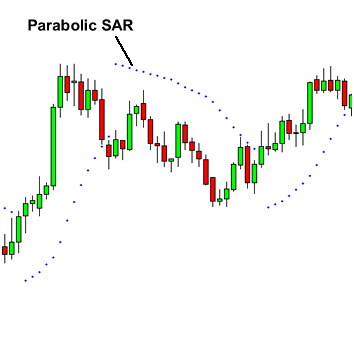
the indicator that can help us determine where a trend might be ending is the Parabolic SAR that means Stop And Reversal. A Parabolic SAR places dots, or points, on a chart that indicate potential reversals in price movement.
you can see that the dots shift from candles below for uptrend and dots shift from candles above for downtrend
How to Trade Using Parabolic SAR
The nice thing about the Parabolic SAR is that it is really simple to use. Basically, when the dots are below the candles, it is a buy signal.
When the dots are above the candles, it is a sell signal.
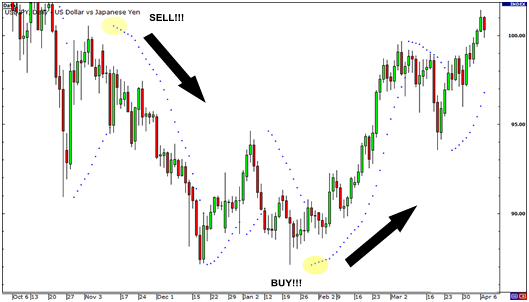
You DON’T want to use this tool in a choppy market where the price movement is sideways.
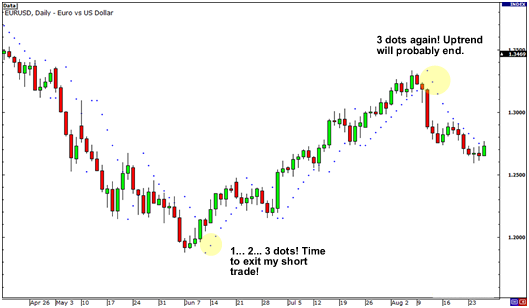
You can also use Parabolic SAR to help you determine whether you should exit your trade or not.
Check out how the Parabolic SAR worked as an exit signal in daily chart above.
In early June, three dots formed at the bottom of the price, suggesting that the downtrend was over and that it was time to exit those shorts.
If you forcefully decided to hold on to that trade thinking that stock would resume its drop, you would’ve probably loss all those profit since the stock trade eventually go up further.